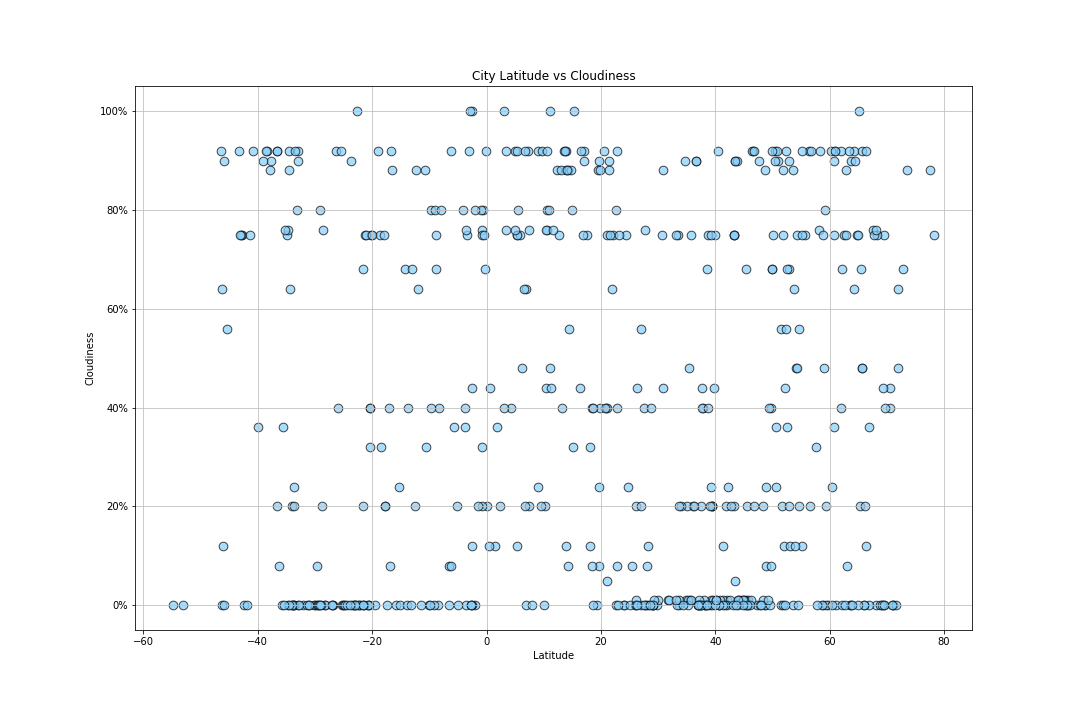
Cloud Cover by Latitude

Cloud cover based on Latitude was a striking visualization. Latitude did not appear to have a strong influence on cloudiness, rather it raised questions about how cloud cover it measured. When compared to the visuals of humidity and wind speed, which both are rather nebulous, cloud levels seemed to bucket in particular % levels. The resulting image appeared to be a series of lines with scattered points between them. These "lines" of data populated around 0%, 20%, 40%, 75%, and 90%. Since cloud cover is generally measured in oktas, which is on a scale of 0-8, it follows that visualzations would populate along particular lines.