Temperature by Latitude
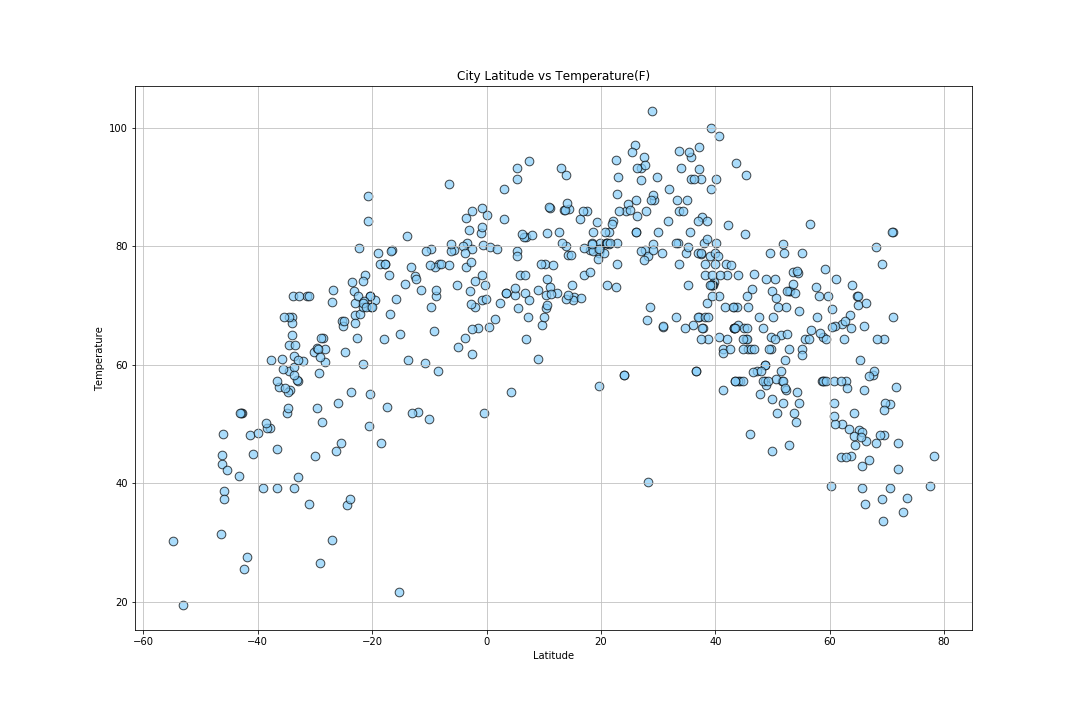
In surveying the data, there (unsurprisingly) appears to be a correlation between latitude and temperature. When visualized in a scatter plot, the points formed a curve similar to a standard distribution with the Tropic of Cancer (23°26ʹ Latitude) at the center. Temperature tended to decrease the further latitude position the city fell from this point. This makes sense considering that the data was compiled during the Northern Hemisphere summer, specifically July 18, 2018.