Background

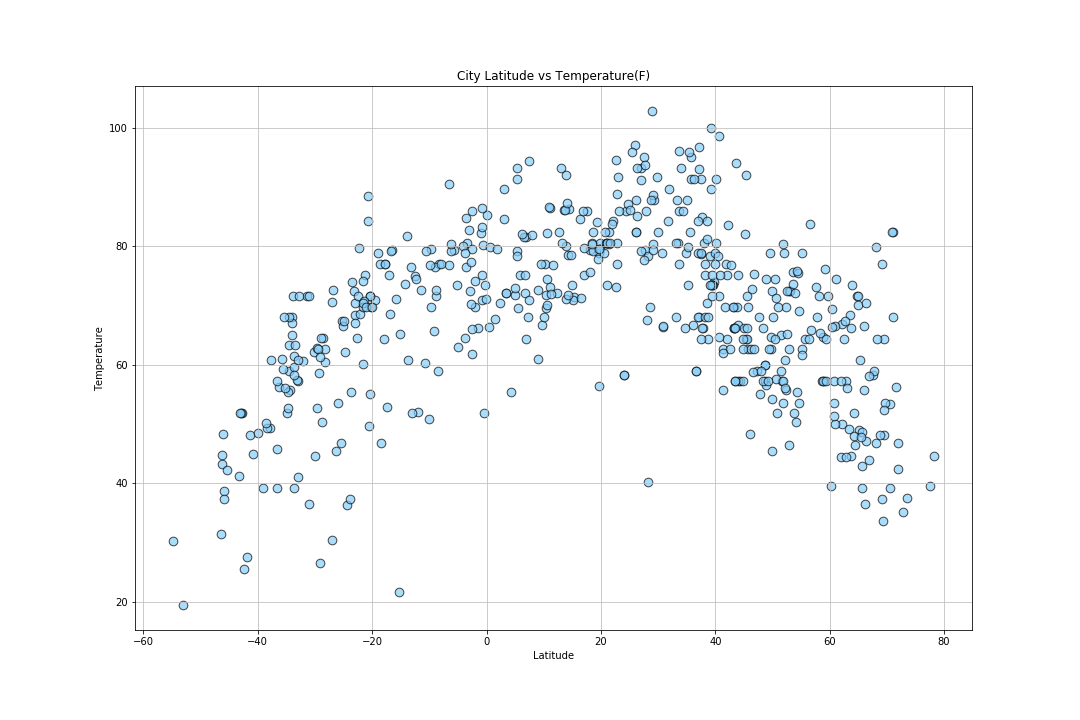
The aim of this project was to observe weather patterns depending on latitude. Specifically, how does a location's proximity to the equator affect weather patterns? Though we can safely assume that the temperature increases, we also know that weather involves more than temperature. Not to mention, it does not hurt to test our assumptions. Hence, this project.
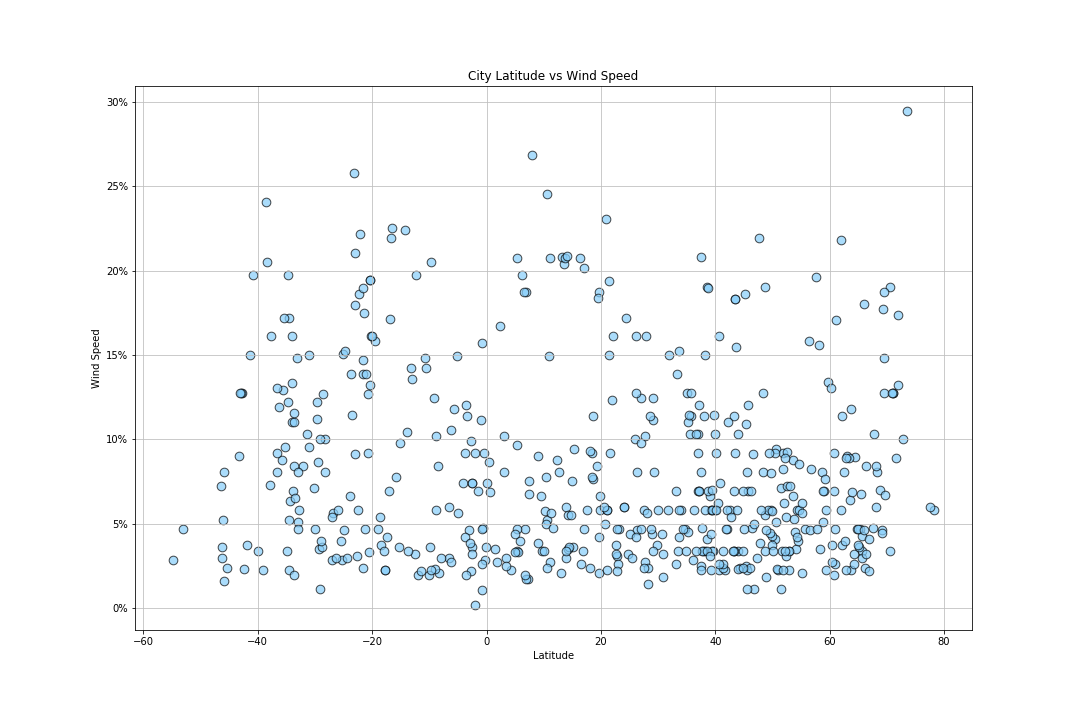
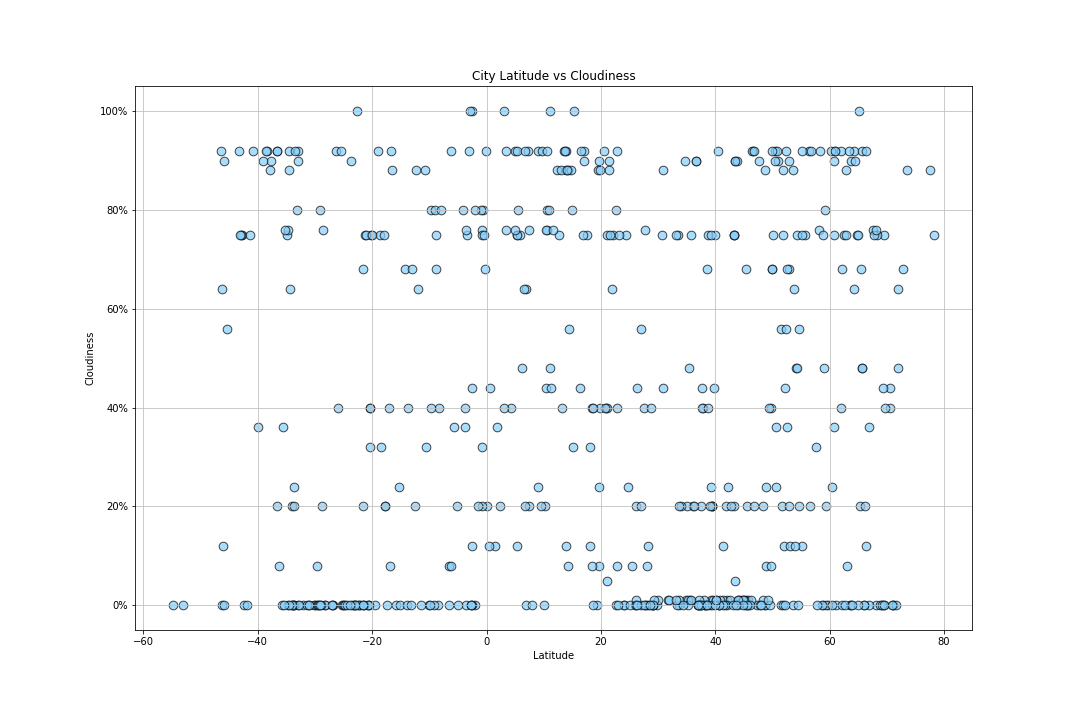
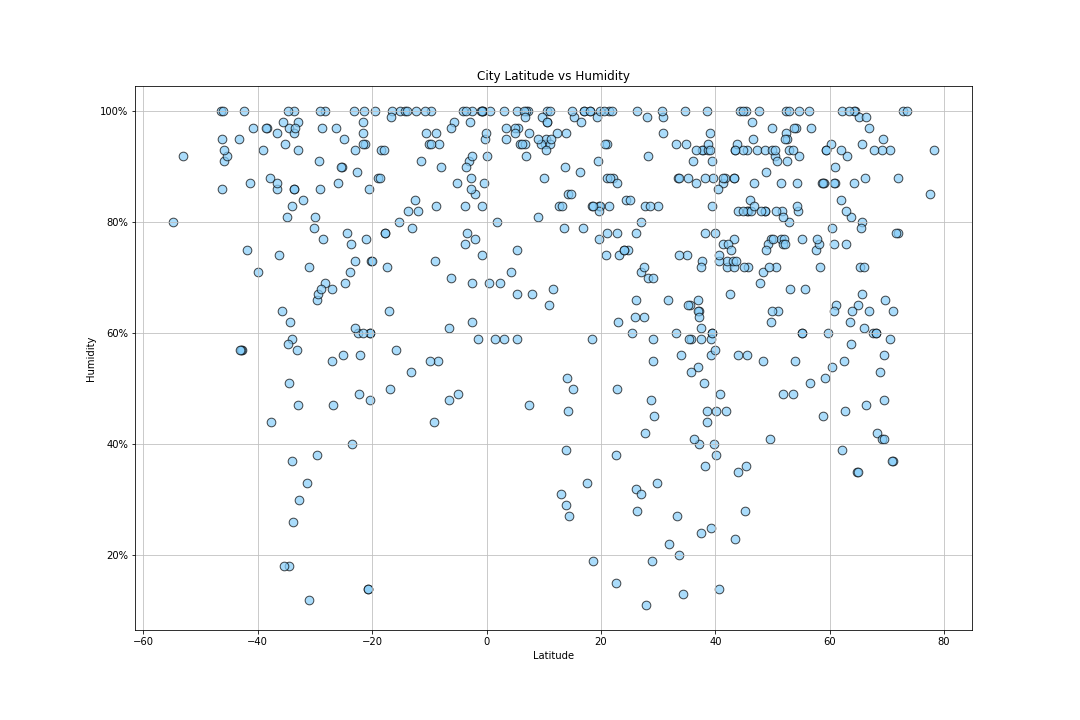
The objective was to utilize the OpenWeatherMap API to gather real-time temperature, cloud cover, wind speed, and humidity metrics for 500 randomly chosen cities. These factors were visualized according to cities' latitudinal position.
This site presents those visuals along with source code and analyses observed. The data was compiled in July 18, 2018.
Process
- NumPy was used to randomly generte numbers to for 1500 latitude and longitude tuples.
- The latitude/longitude pairs were iterated through citipy to find a coresponding city. The measurement was discarded if no city was found. 620 cities were found successfully.
- API calls were performed on the 620 cities, achieving 557 successful calls.
- The cities and the data retrieved from the calls were stored in pandas and then visualized via matplotlib.